FPL Analysis Tool
An interactive scatter plot tool for comparing Fantasy Premier League player stats, built to make transfer decisions less of a guessing game.
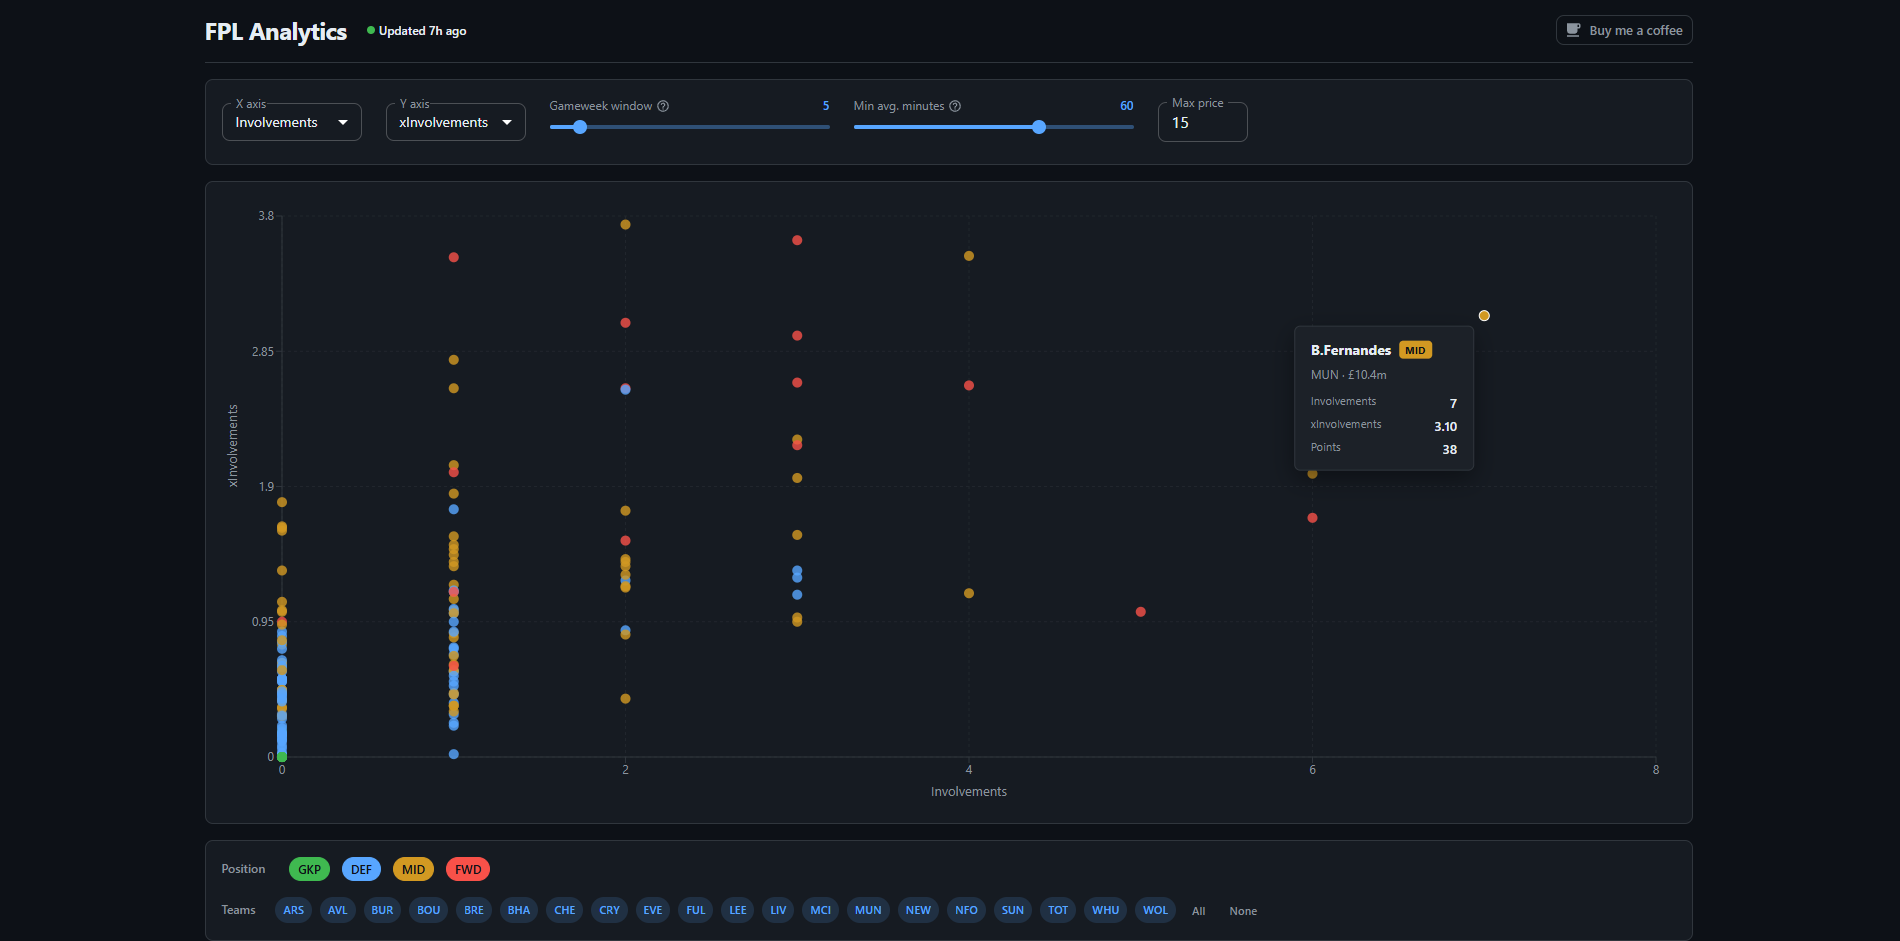
What is it?
The tool is an interactive scatter plot where both axes are configurable and illustrate a range of stats covering attacking output, defensive metrics and general performance per player. A sliding window lets you focus on the last N gameweeks rather than the full season, a minimum minutes filter cuts out players who aren't getting regular game time, and players are colour coded by position so it's easy to see at a glance where a potential signing fits in your squad.
The point of having all that configurability is that the useful question changes week to week. Early in the season you might want to plot xG against cost to find undervalued attackers the market hasn't priced up yet. Mid-season you might narrow the window to the last 5 gameweeks and look at points or goal involvements to find who is actually in form right now. Comparing xG against actual goals is handy for spotting players who are running hot and are probably due a regression, so you can sell before everyone else does. It also works the other way, picking up players with strong underlying numbers who just haven't converted yet.
Architecture
The whole stack runs on a Raspberry Pi in my living room. Docker Compose orchestrates everything: an Nginx container handles routing and serves the built React frontend as static files, a Python/Flask container serves the API, and a MySQL container holds the data. A Cloudflare tunnel connects the Pi to the internet without any port forwarding, so requests hit Cloudflare's edge and get routed through to the Pi from there.
The FPL API doesn't expose a single endpoint that returns all player data at once. Getting gameweek-by-gameweek stats for every player means calling a separate endpoint per player, which adds up to around 600 requests each time. That rules out fetching on-demand when someone loads the page, so a cron job runs every night to do the full sync and store the results in MySQL.
The frontend uses Recharts for the scatter plot, which made it straightforward to build a fully interactive chart with custom tooltips, click handling and responsive sizing. MUI handles the rest of the UI, and React Query manages the data fetching and caching so the chart doesn't re-request data it already has.